B2B Paid Media Benchmarks - Guide for B2B Marketers
Measuring Performance
Demand generation is a critical component of any successful marketing strategy. As a B2B demand generation manager, setting realistic expectations, accurately measuring performance, and continuously optimizing campaigns are essential. This guide provides a clear framework for implementing demand generation benchmarks across various channels.
Why Benchmarks Matter
Benchmarks help you set realistic goals, measure performance, and identify areas for improvement. They provide a standard against which you can compare your campaigns, ensuring you are on track to achieve your objectives.
Benchmarking Methodology
We analyzed data from over 30 B2B SaaS companies between January 1st and December 31st, 2023. The analysis covered $8.2 million in spend and 308 million impressions across Meta (Facebook & Instagram) and LinkedIn.
Channel Performance Benchmarks
Meta (Facebook & Instagram)
- CPM (Cost Per Thousand Impressions):
- Facebook: $4.00 (-35% YoY)
- Instagram: $5.00 (-20% YoY)
- CTR (Click-Through Rate):
- Facebook: 0.60% (+10% YoY)
- Instagram: 0.50% (+8% YoY)
Insight: Meta channels have seen a significant decrease in CPM, making them more cost-effective. CTR has increased, indicating better engagement.
B2B Demand Generation Benchmarks for 2024
How to measure performance, set expectations, and optimize campaigns
Demand generation is a critical part of any modern B2B marketing strategy. For demand generation managers, the ability to set clear expectations, measure the right metrics, and optimize based on performance is what drives growth.
This guide outlines current demand generation benchmarks across key platforms like LinkedIn and Meta (Facebook and Instagram), with data from $8.2 million in spend across 30+ B2B SaaS companies in 2023.
Why Benchmarks Matter
Benchmarks help marketers:
- Set realistic goals
- Track progress across campaigns
- Spot inefficiencies and areas for optimization
Without them, it’s difficult to know what success looks like or where you stand.
How These Benchmarks Were Created
Refine Labs analyzed data from January 1 to December 31, 2023, across 30+ B2B SaaS companies. The dataset included:
- $8.2 million in total ad spend
- 308 million impressions
- Meta (Facebook + Instagram) and LinkedIn campaigns
This data powers the channel, objective, and placement-level benchmarks below.
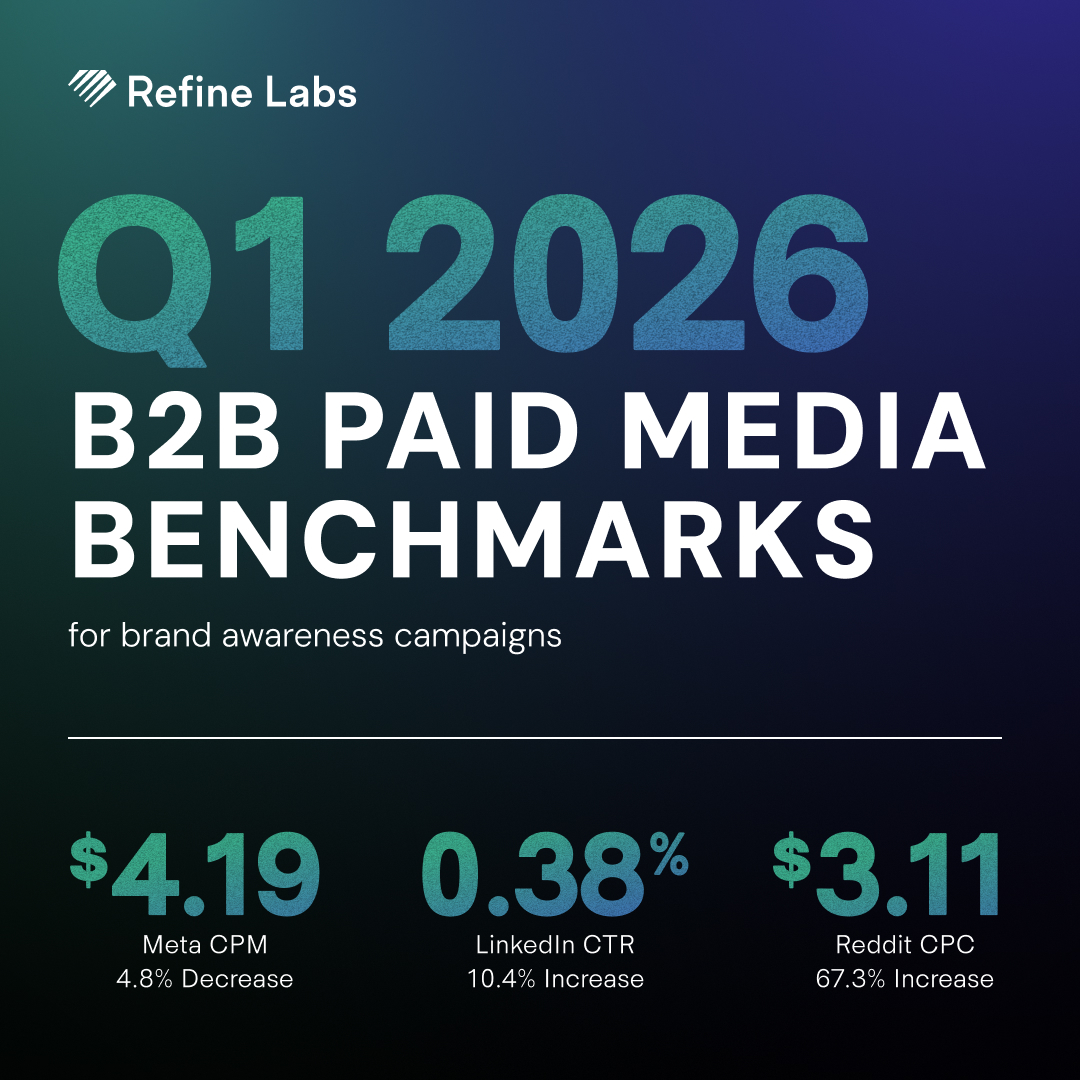
Channel Performance Benchmarks
Meta (Facebook & Instagram)
- Facebook CPM: $4.00 (down 35% YoY)
- Instagram CPM: $5.00 (down 20% YoY)
- Facebook CTR: 0.60% (up 10% YoY)
- Instagram CTR: 0.50% (up 8% YoY)
Takeaway: Meta platforms are becoming more cost-effective, with improved engagement rates.

- LinkedIn CPM: $50.00 (up 48% YoY)
- LinkedIn CTR: 0.53% (up 5% YoY)
Takeaway: LinkedIn remains high-cost, but quality and engagement justify continued investment.

Objective-Based Benchmarks
- Traffic Campaigns: CPM $5.00 | CTR 1.20%
- Engagement Campaigns: CPM $10.00 | CTR 0.80%
- Lead Generation Campaigns: CPM $20.00 | CTR 0.40%
- Reach and Awareness Campaigns: CPM $8.00 | CTR 0.30%
Takeaway: Traffic campaigns consistently deliver the strongest CTRs. Lead gen and awareness require higher spend and offer lower conversion performance.
Placement-Based Benchmarks
Meta Placements
- Stories: CPM $4.00 | CTR 0.70%
- Reels: CPM $12.00 | CTR 0.40%
- Feed: CPM $5.00 | CTR 0.50%
Takeaway: Stories drive better engagement at a lower cost. Reels require higher investment and more compelling content to perform.
LinkedIn Placements
- Single Image Ads: CPM $60.00 | CTR 0.50%
- Video Ads: CPM $70.00 | CTR 0.60%
- Document Ads: CPM $80.00 | CTR 0.70%
Takeaway: Document ads are emerging as a high-performing format, especially for deep, value-driven content.
Year-over-Year Performance Trends
Meta
- CPM Decrease: -35%
- CTR Increase: +10%
- CPM Increase: +48%
- CTR Increase: +5%
Emerging Formats:
- Document Ads: High engagement potential
- Thought Leader Ads: Early performance looks promising
Trend: In-feed content is dominating. Meta costs are dropping, while LinkedIn remains expensive but sticky.
How to Use These Benchmarks
1. Establish Internal Baselines
Compare your campaign data to industry benchmarks to identify gaps and opportunities.
2. Continuously Optimize
Refine your creatives, placements, and targeting. Test new formats like Document Ads and Thought Leader Ads to stay ahead.
3. Align Spend to Performance
Use benchmarks to guide budget allocation. Don’t over-invest in one channel just because it’s familiar or easier to attribute.
Quick Reference: B2B Ad Benchmark Cheat Sheet
Key Metrics
- CPM (Cost per Thousand Impressions)
- CTR (Click-Through Rate)
- Engagement Rate
Industry Averages
- Meta: CPM $5.00 | CTR 0.55%
- LinkedIn: CPM $65.00 | CTR 0.53%
Best Practices
- Diversify placements across feed, video, stories, and documents
- Prioritize in-feed content consumption
- Regularly review and update internal benchmarks
Benchmarks are not static. They’re a starting point. The most successful teams treat them as part of an ongoing feedback loop, not a final answer.
If you're running demand programs and want help aligning budget with ROI, Refine Labs has helped hundreds of B2B companies do exactly that. Let’s talk.
___
Check out the Content Hub for more insights from Refine Labs.